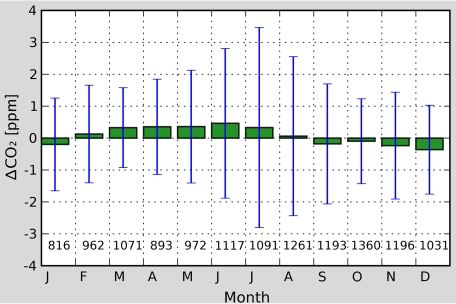
Fig. 4.
Modeled-minus-observed CO2 for a set of 13,000 observations in the free troposphere. The differences are averaged by month (green bar), and the range (blue) indicates the standard deviation. The number below each bar denotes the number of observations used in the statistic. Note that all data collected through NOAA's Aircraft Program were not used in the assimilation and are thus an independent check on the estimated fluxes as well as vertical transport in the TM5 model. Units are mole fraction expressed as ppm.

