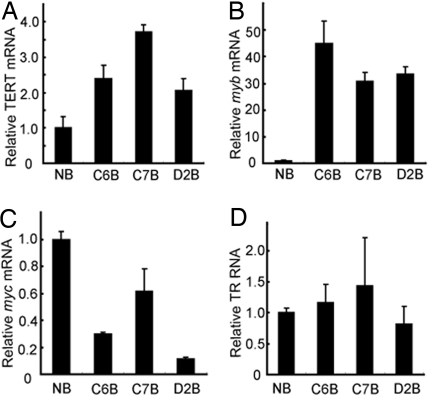
Fig. 2.
Expression levels of TERT (A), myb (B), myc (C) and TR (D) in normal bursa and bursa tumors. RNA levels were measured by real-time RT-PCR using gene-specific primers and were normalized relative to GAPDH mRNA levels. Bursa tumor RNA levels were plotted relative to levels in uninfected normal tissues.

