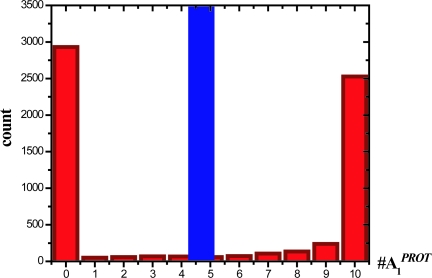
Fig. 2.
Bimodal stochastic solutions distinct from the unique deterministic solution. Histogram showing the bimodal distribution of the protected agonists at steady state (red) for a situation when there are 10 agonist (A1) and 10 antagonists (A2). The corresponding single steady state solution of the deterministic ODEs (blue) is also shown. The other parameter values are: k1 = 1, k2 = 1, k3 = 100, k4 = 1, k5 = 100, kD = 1 (all s−1), and statistics were collected over 5,000 trajectories obtained by using the Gillespie algorithm. The result is robust to variations in the parameter values as long as there is strong feedback.

