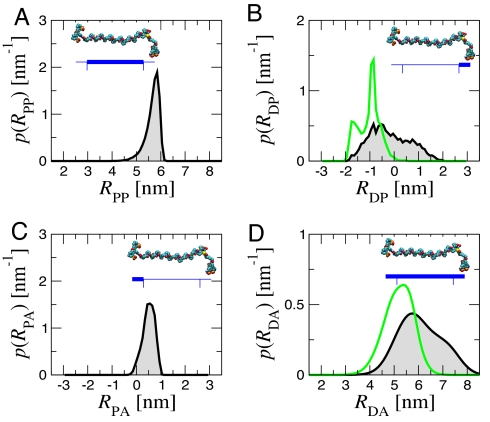
Fig. 5.
Contributions to donor-acceptor distance distributions from simulation. (A) Length of polyproline-20 (distance between the amide nitrogen of Pro-2 and carboxyl carbon of Pro-21 in Gly(Pro)20Cys) for all-trans polyproline (black). (B) The projection of proline-donor distance onto the N-C vector for trans (black) and cis (green) residues at the C terminus. (C) The corresponding distribution for proline-acceptor distance. (D) Resultant distribution of donor-acceptor distances for all-trans (black) and C-terminal cis only (green). The bimodal shape for C-terminal cis arises from transient sticking of the dye to the polyproline. (Insets) The part of the molecule whose fluctuations are plotted.

