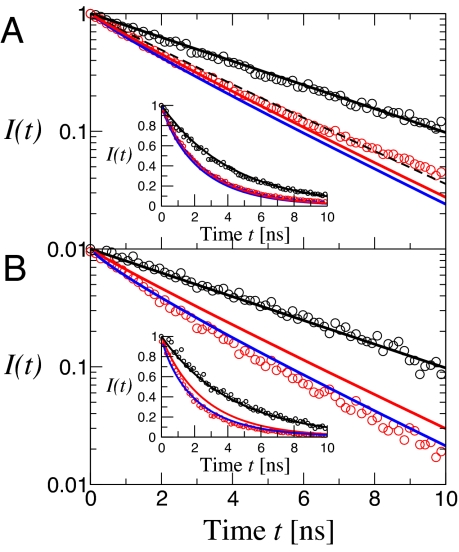
Fig. 6.
Donor fluorescence decays from polyproline-20 in TFE (A) and water (B). The distribution of donor time delays (i.e., between the laser pulse and donor photon detection) for bins belonging to the “donor-only” peak in the efficiency histograms (Fig. 3), defined as 0.0 < E < 0.1 is given by open black symbols and the time delay distribution for the remainder of the histogram (E > 0.2) by open red symbols. The solid black lines represent exponential decay of the fluorescence from the donor-only peaks with a lifetime of 4.3 ns. Intensity decays calculated from simulations of all-trans polyproline-20 are given by solid red lines. In A, the solid blue curve is the result of adding a 12.5% population of cis proline at the C terminus; the broken black curve is the expected lifetime distribution for a rigid all-trans polyproline. In B, the solid blue curve represents the lifetime distributions of all 38 possible species from simulation, weighted by the populations estimated from NMR. The same data are plotted on a linear scale in the Insets.

