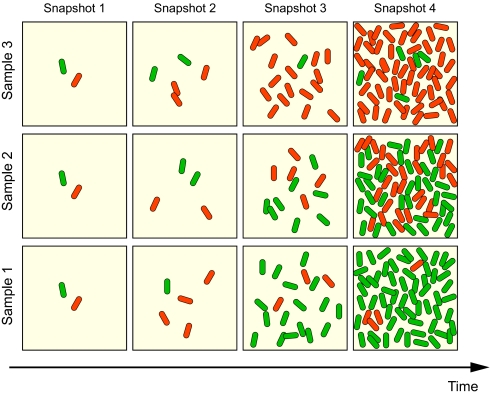
Fig. 2.
An illustration of the ensemble population diversity. The initial state 1:1 is the same for each set of snapshots. Here, the colors represent distinct phenotypes. Cells grow, divide, and die according to the dynamics shown in Fig. 1. Four snapshots are taken at specific times for each trial.

