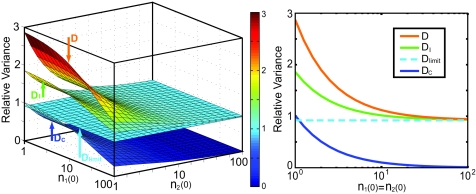
Fig. 3.
Asymptotic (t→∞) relative variance with respect to different initial distributions. (Left) The four surfaces correspond to cross-colony, deterministic, intracolony, and total population variance, from bottom to top, respectively. (Right) A cross-section of the variation indices along the line n1 (0) = n2 (0). The asymptotic variance differs from the deterministic prediction but approaches it when the initial numbers of cells are large. Initial phenotypes are assumed to be δ-distributed, and parameters are the same as those in Fig. 1b.

