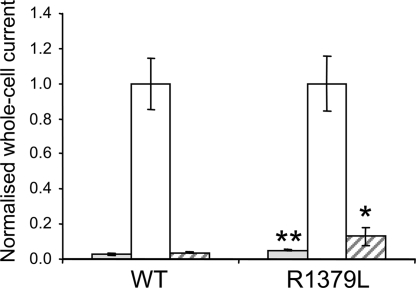
Fig. 3.
Mean steady-state whole-cell KATP currents evoked by a voltage step from −10 to −30 mV before (control, gray bars) and after (white bars) application of 3 mM sodium azide, and in the presence of 3 mM azide plus 0.5 mM tolbutamide (hatched bars) for wild-type channels (n = 12) and R1380L channels (n = 13). *, P = 0.05; **, P = 0.01 compared with control (t test).

