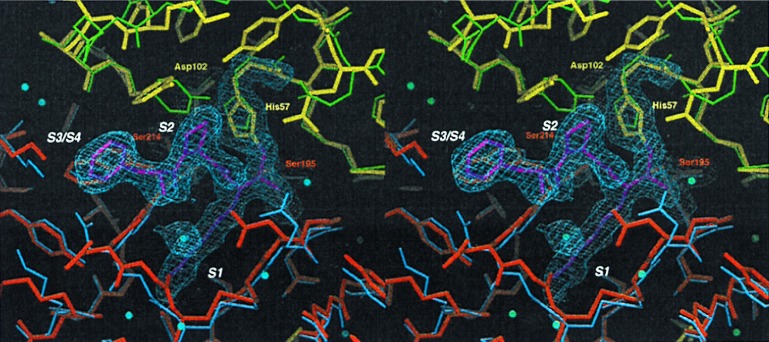
Figure 3.
Comparison of the active site of fXYa to fXa and trypsin. Final model of fXYa showing the active site (thick sticks using the color code of Fig. 2) with representative 1.0 σ contoured 2Fc-Fo electron density for the catalytic tetrad residues His52, Asp102, Ser195, and Ser214 as well as for the PPACK inhibitor. The N-terminal subdomain of fXYa (red) is superimposed with the N-terminal subdomain of fXa (blue); the C-terminal subdomain (yellow) is superimposed with the C-terminal subdomain of trypsin (green). The structure shows a well conserved catalytic triad and specificity pocket. Some side chain adjustments in substrate binding sites (S1-S3) presumably originate from interaction with PPACK.

