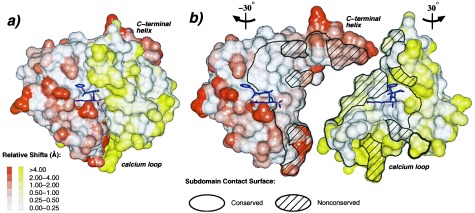
Figure 4.

Plasticity of the domain interface. (A) Connolly surface representation of rfXYa using the orientation and colors of Fig. 2. The surface was calculated for each subdomain separately. The extent of displacement of rfXYa surface atoms relative to the parent molecules after Ca superposition of the corresponding subdomains is color coded (Inset). PPACK (magenta) is shown as stick model. (B) Same as A but with N- and C-terminal subdomains rotated −30° and +30° about the vertical axis and separated to display the subunit interface. A stick model of the inhibitor (magenta) is displayed with each subdomain to clarify the respective orientation and to mark the location of the active site. The black bounded area denotes the contact surface of both subdomains; the shaded areas indicate surfaces of residues that differ between fX and trypsin. Core elements of the interface are structurally conserved. Surface patches of the interface are often deformed, especially at positions where nonconserved residues from both subdomains contact each other, such as the C-terminal helix and the calcium loop. These deviations involve both main chain and side chain geometry.
