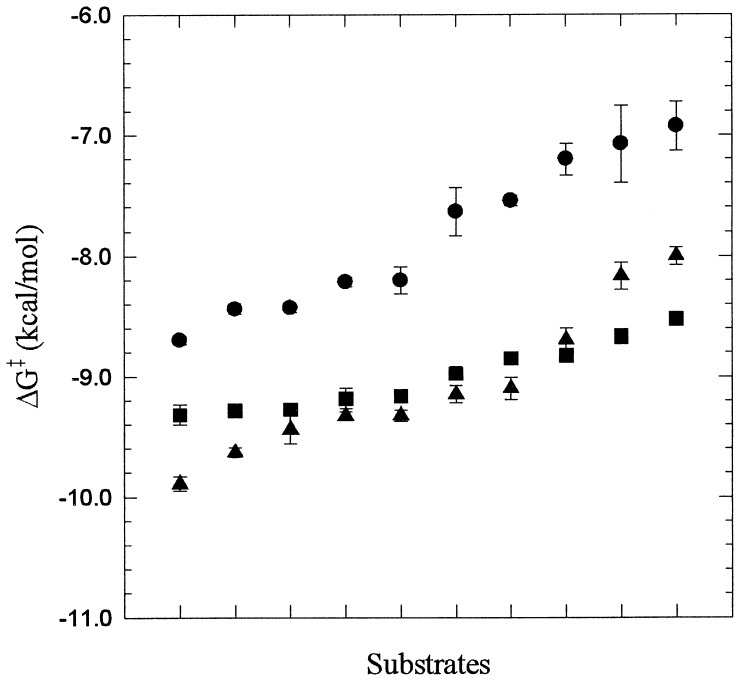
Figure 6.
Plot of the transition state stabilization free energy ΔG‡ = −RTln(kcat/Km/knon) (35) for hydrolysis of substrates listed in Table 1 by rfXa (•), rfXYa (■), and rtrypsin (▴). The rate of the noncatalyzed reaction knon is independent of the enzyme used and was set to 1 for the purpose of the comparison. The SEs are shown as bars. To indicate selectivity, the substrates are sorted according the increasing ΔG‡ values for each of the enzymes separately.

