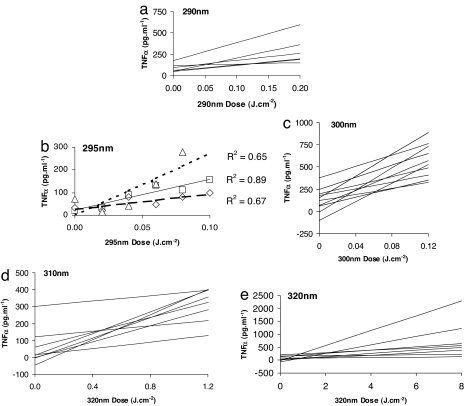
Fig. 1.
Linear regression analyses. (a) 290 nm. (b) 295 nm. (c) 300 nm. (d) 310 nm. (e) 320 nm. Inclusion criteria for all volunteers included a 300-nm MED of either 0.028 or 0.040 J·cm−2. Regressions are based on the mean TNFα value of two samples. (b) Individual data points and r2 values for the three volunteers in this group.

