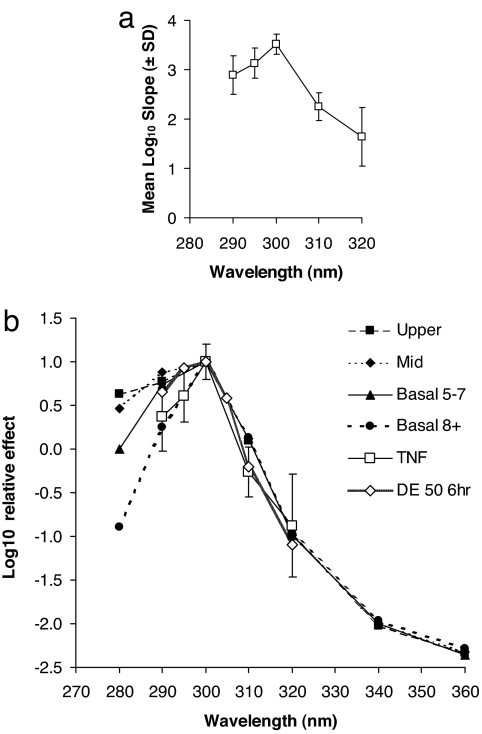
Fig. 2.
Action spectra for TNFα, DNA photodamage, and erythema. (a) Action spectrum for TNFα induction ± SD at 8 h. (b) TNFα spectrum (± SD) in comparison with action spectra for CPD in four different epidermal layers (upper, middle, and basal layers at two depths) at 0 h (13) and a just-perceptible erythema (DE = 50) measured by reflectance spectroscopy at 6 h in the current TNFα study volunteers. Note that (i) all data are normalized at 300 nm; (ii) TNFα was not measured at 305 nm because the manufacturer stopped production of the ELISA kits that we used; and (iii) basal 5–7 cells are found in layers 5–7, and basal 8+ is more than eight cell layers deep.

