Fig. 6.
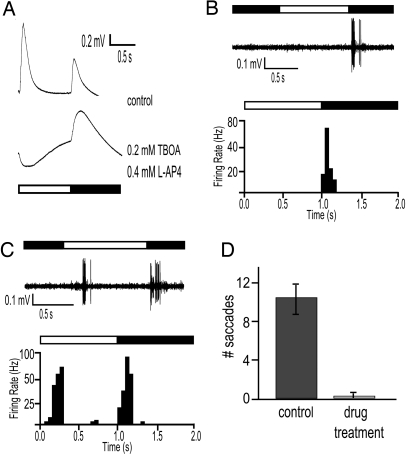
Pharmacological block of the ON pathway. (A) ERG traces from control and drug-treated zebrafish larvae at 5 dpf. The b wave is completely abolished in retinas of the fish treated with the drug mixture. The d wave amplitude is not significantly increased after the drug mixture treatment but is prolonged. Example of an OFF type (B) and ON-OFF type GC (C) in response to a 1-s full-field illumination after drug treatment. Note the long latency of the ON component of the ON-OFF GC response. (D) OKR assay performed on control animals (n = 30) and animals treated with the drug mixture (n = 30). The fish treated with the drug mixture lose their ability to respond in the OKR test.

