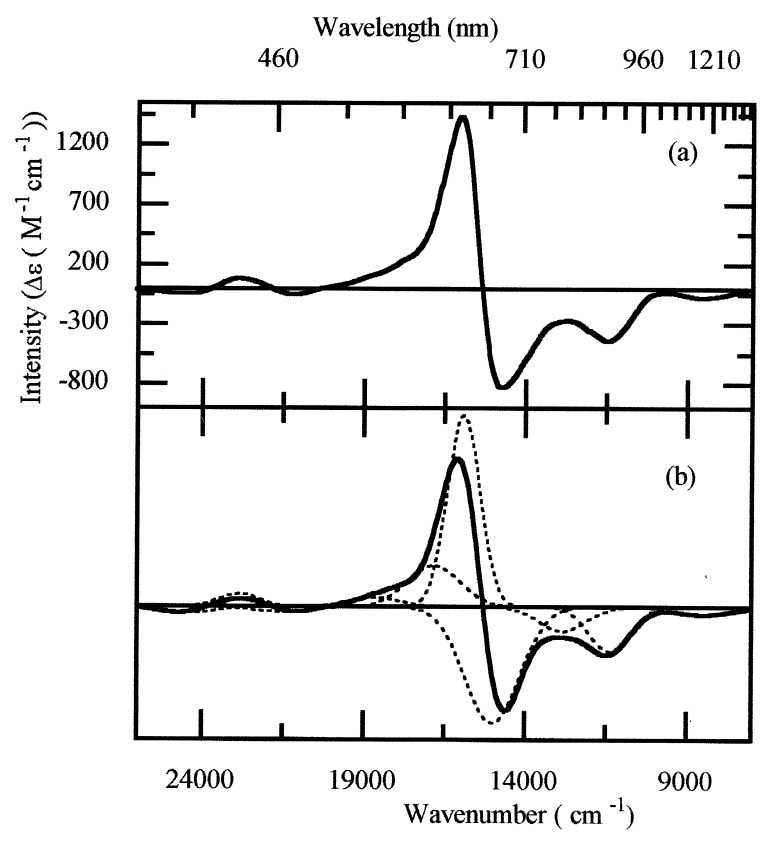
Figure 1.
(a) 4.2 K of MCD spectrum of dithionite-reduced N2OR, sample 1. (b) The solid line shows a fit of the experimental MCD data, obtained as a sum of the individual Gaussian curves shown as dotted lines. Full details of the curve parameters are given in Table 1.

