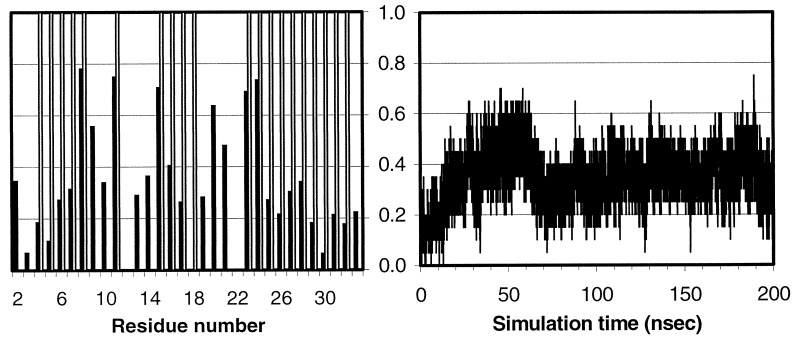
Figure 3.
Helical content measured by the mainchain φ-ψ angle (−60 ± 30, −40 ± 30) from 10,000 snapshots (20 psec intervals). (Left) The average over the trajectory. The shaded bars represent the residues that are helical in the NMR structure. (Right) The fractional native helical content (i.e., those presented in both the native and the simulated structures divided by the total in the native structure) as a function of time.

