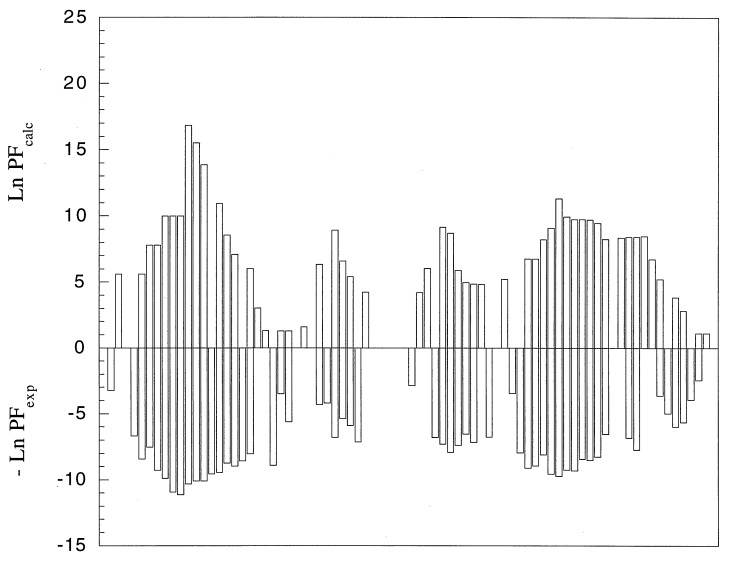
Figure 1.
Natural logarithm (bars) of the calculated and experimental protection factors for λ6–85. The calculated values were determined as described by Hilser and Freire (12). The solid line above the calculated values represents the residue stability constant as defined from Eq. 1. This quantity is defined for all residues independently of whether they exhibit protection or not. Shown also in the figure are the corresponding elements of secondary structure. The good agreement between calculated and experimental values indicates that the calculated ensemble captures the general features of the actual ensemble and that the network of cooperative interactions in the protein are represented accurately in this model.

