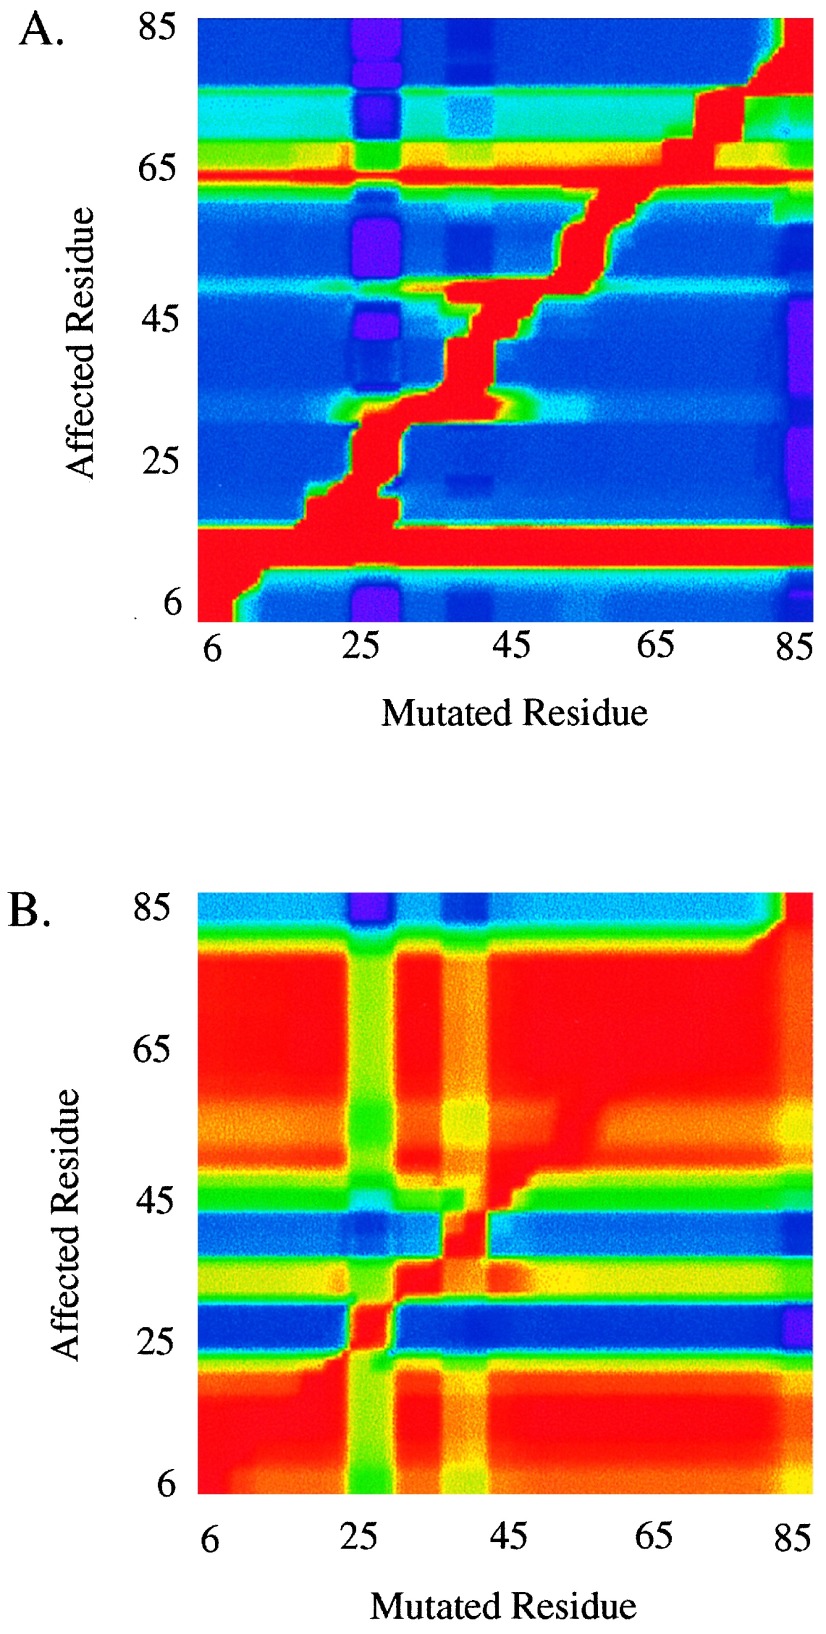
Figure 2.
SSTM analysis of λ6–85 at (A) ΔGU = 8.5 kcal/mol and (B) ΔGU = 2.5 kcal/mol. Plotted is ΔΔGj,mutk (ΔGjmutk−ΔGjWT; where ΔGj = −RT ln κf,j), which represents the change in free energy at each residue j (ordinate) caused by a mutation at residue k (abscissa). For these calculations, the free energy of all states in which residue k is folded is stabilized by 1.0 kcal/mol. Red corresponds to a large effect (1.0 kcal/mol) whereas blue corresponds to a small effect (≈0.0 kcal/mol).

