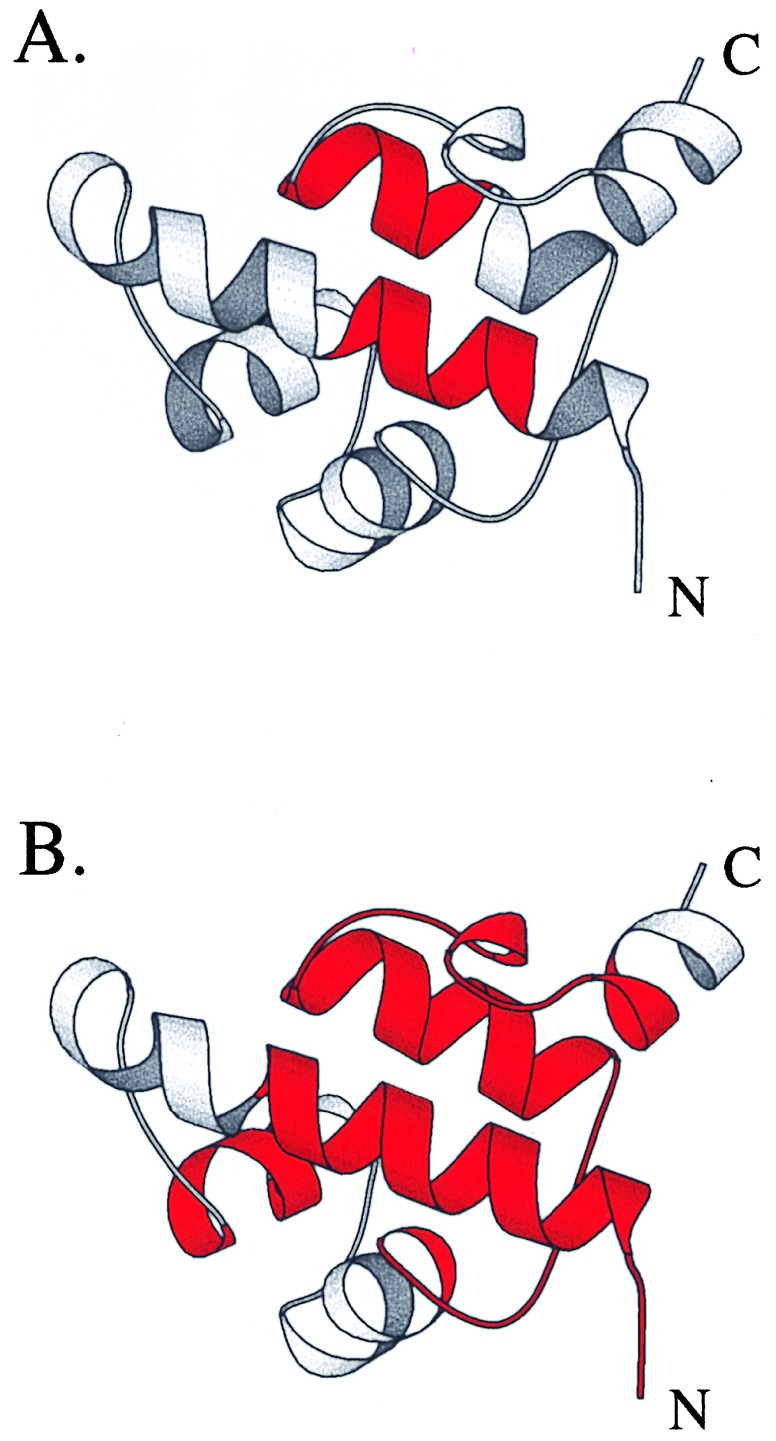
Figure 4.
Ribbon diagrams of λ6–85 showing residues (colored red) that correspond to the cooperative core at (A) ΔGU = 8.5 kcal/mol and (B) ΔGU = 2.5 kcal/mol. Although distal in sequence, core residues represent a contiguous cluster in the three dimensional structure. This figure was generated by using the program molscript (32).

