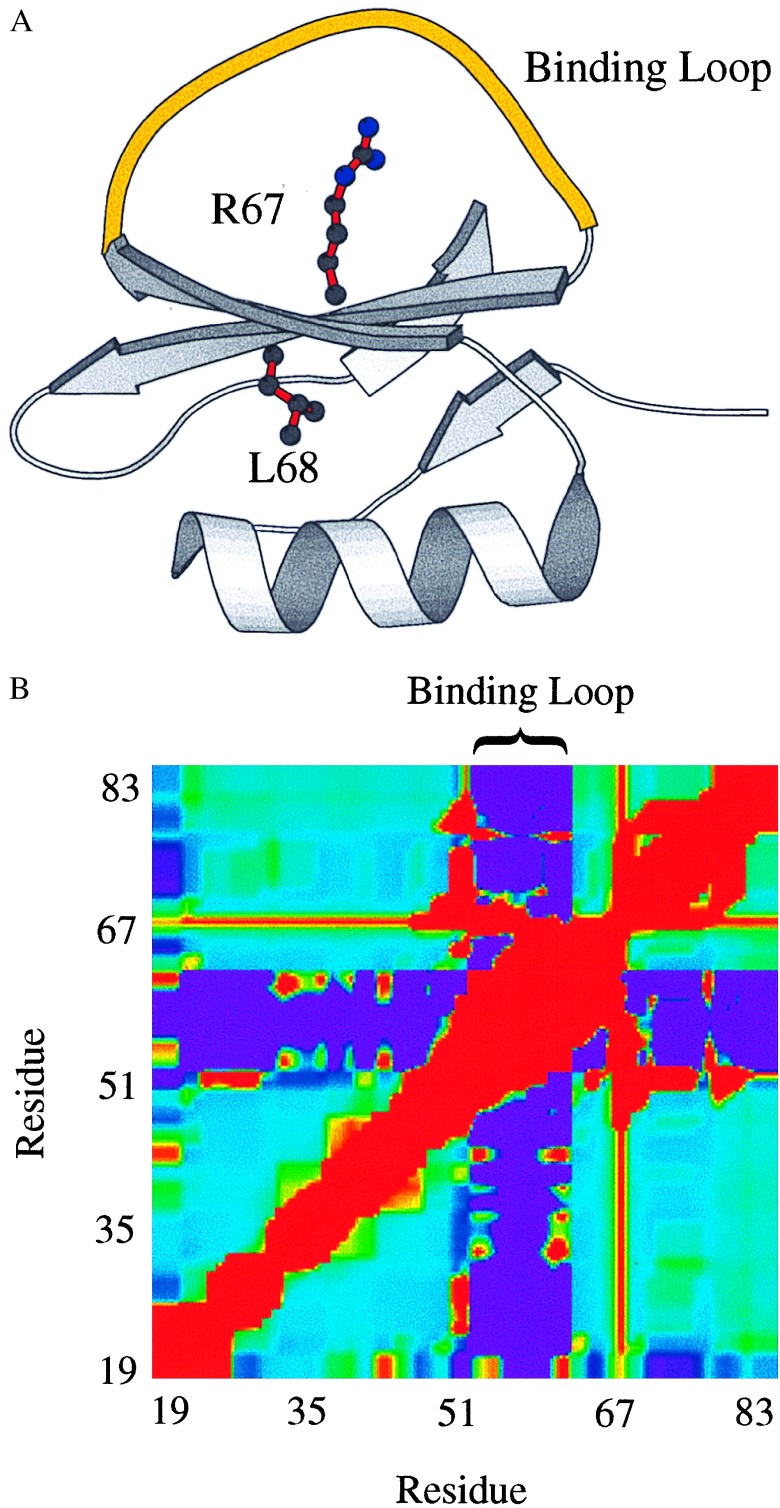
Figure 5.
(A) Ribbon diagram of CI2 showing the binding loop (residues 53–62) highlighted in yellow. Side chains for the key linchpin residues R67 and L68 are shown. Both residues are part of the central β-strand; R67 projects into the binding loop, and L68 projects into the hydrophobic core formed by the β-sheet and the α-helix. This figure was generated by using molscript. (B) Mutual perturbation/response analysis of CI2 under native conditions. Plotted is ΔΔGMPR (Eq. 2) for each pair of residues, highlighting the difference between large (red), intermediate (blue), and small (purple) effects. Labeled are those residues belonging to the binding loop.

