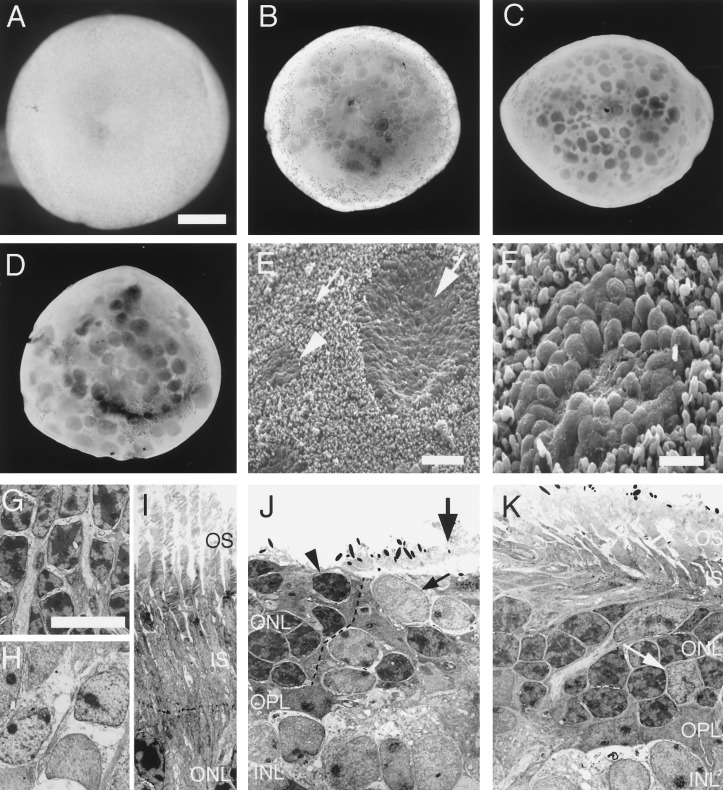
Figure 2.
Cell death in the cyclin D1 mutant retinas. (A–D) Dark field images of intact retinas. (A) Wild-type, P10. (B) Cyclin D1−/−, P10. (C) Cyclin D1−/−, P21. (C) Cyclin D1−/−, P180. (E and F) Scanning electron microscopy images of the outer segment surface of a P21 cyclin D1−/− retina. (F) High magnification view of the area indicated by the arrowhead in E. Small arrow in E points to a small cluster of cells that protrude into the outer segment layer. Arrowhead in E points to a large cluster of cells that appear to be in an expanding hole. Large arrow in E points to a large hole. (G–K) TEM images of retinal sections. (G–I) P21 wild-type retina. (G) Nuclei in the ONL. (H) Nuclei in the INL. (I) Inner and outer segments of photoreceptors. (J and K), P21 cyclin D1−/− retina. (J) A hole (indicated by the large arrow) and the boundary of the hole (indicated by the dashed line). Note the presence of cells with INL cell morphology (small arrow) in the hole at the ONL level and the photoreceptor cells without inner or outer segments (arrowhead) at the boundary of the hole. (K) An area that is not a hole. Note the presence of many pale nuclei in the ONL (arrow) and reduction in the length of the inner and outer segments of the photoreceptors. OPL, outer plexiform layer. OS, outer segment. IS, inner segment. (Scale bar in A is 500 μm; A–D are to the same scale. Scale bar in E is 20 μm. Scale bar in F is 5 μm. Scale bar in G is 5 μm; and G–K are to the same scale.)

