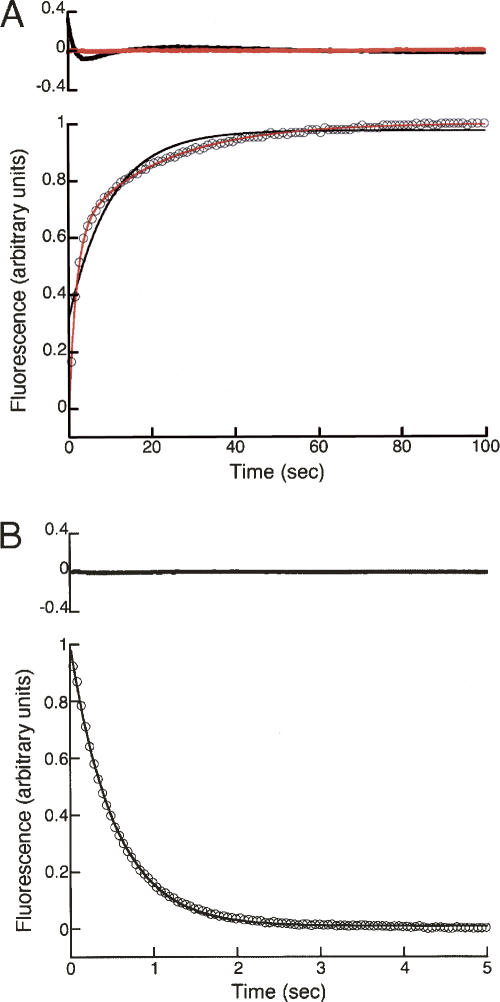
Figure 4.
Fluorescence-detected refolding and unfolding of InlB. (A) Refolding was initiated by rapid dilution of urea from 3 M to 0.18 M. Refolding data (circles) were fitted with single- and double-exponential functions (black and red solid lines, respectively) according to Equation 6. (B) Unfolding was initiated by rapid addition of urea from 0 M to 2.95 M. Unfolding data (circles) were fitted with a single-exponential function (black line) according to Equation 6. Upper panels show residuals for each fit. For clarity, only every 10th data point is shown in each panel.

