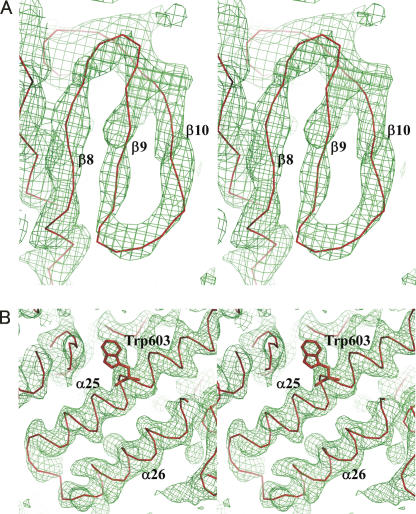
Figure 4.
A representative electron density map. (A) 2Fo−Fc simulated annealing omit map for residues 210–217, at contour level 1.0 σ. The Cα trace from strand β8 to β10 is shown in red. (B) 2Fo−Fc simulated annealing omit map for residues 591–614, at contour level 1.0 σ. The Cα trace from strand α25 to α26 is shown in red. Trp603 is shown in stick representation.

