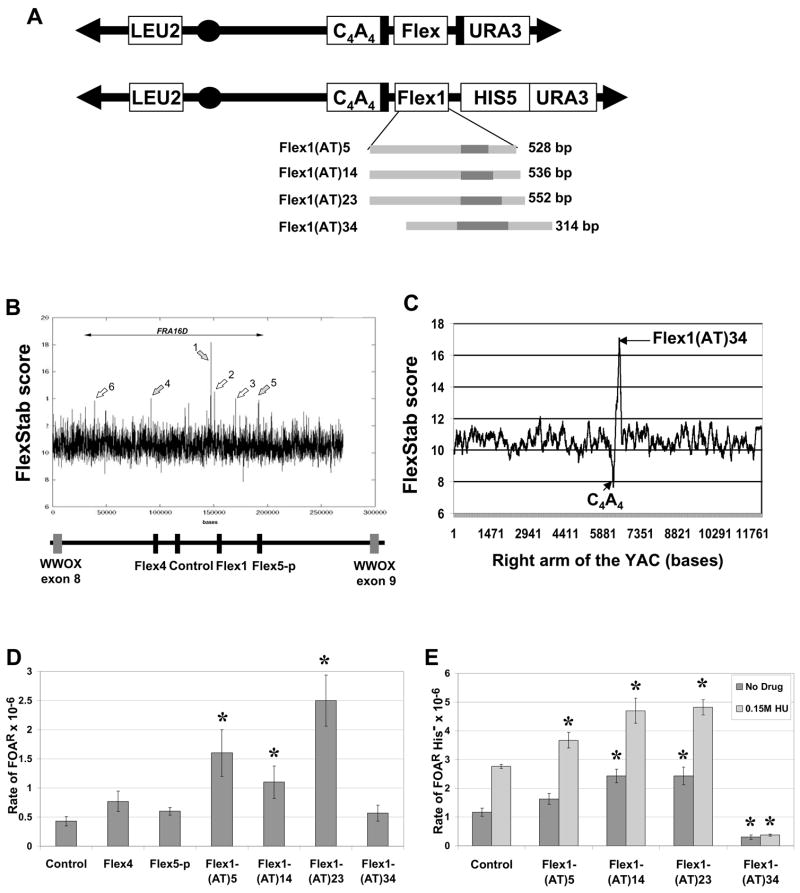
Figure 2. The Flex1 sequence increases chromosome breakage.
(A) Structure of the YACs containing the subregions of FRA16D diagrammed in (B) (denoted as “Flex”). Two types of YACs were created, either without (top) or with (bottom) the HIS5 gene. The black bars flanking the Flex region represent homologous sequences. For the four Flex1 sequences diagrammed, the dark grey bars represent the perfect AT repeat region. Flex1(AT)5, (AT)14 and (AT)23 are exactly the same except for the AT repeat number; Flex1(AT)34 contains 101 bp of extra distal sequence, and lacks 400 bp of the proximal sequences compared to the other Flex1 sequences. (B) The FlexStab score of the FRA16D region. Basepairs are on the X axis. Grey arrows represent the flexibility peaks used for this study. Below it, the exons of the WWOX/FOR gene are represented by grey boxes. Regions chosen for analysis in the present study are represented by black boxes: Flex4 is 1349 bp, Flex5-p is 2054 bp, Flex1 is 314–552 bp. The control sequence is 1320 bp or 400 bp. (C) The flexibility score of the right arm of the top YAC shown in (A). (D) Results of the breakage assay in the rad52Δ background using the top (URA3) YACs diagrammed in (A). The control is 1320 bp. The experiment was repeated at least 3 times for each strain, average with SEM is shown. * P < 0.05 compared to the control by a pooled variant t-test (E) Breakage assay using the Flex1-HIS5 YAC in the wild-type background in the absence (dark grey) or presence (light grey) of hydroxyurea. FOAR colonies were replica plated to YC-His plates, and only the His− colonies, indicating FOAR due to YAC breakage, were used to calculate a rate of FOAR His−. A 400 bp control was used (similar in size to the cloned Flex1 regions). The experiment was repeated at least 3 times for each strain, average with SEM is shown. * P < 0.05 compared to the respective control (either no drug control or 0.15 M hydroxyurea control) by a pooled variant t-test.

