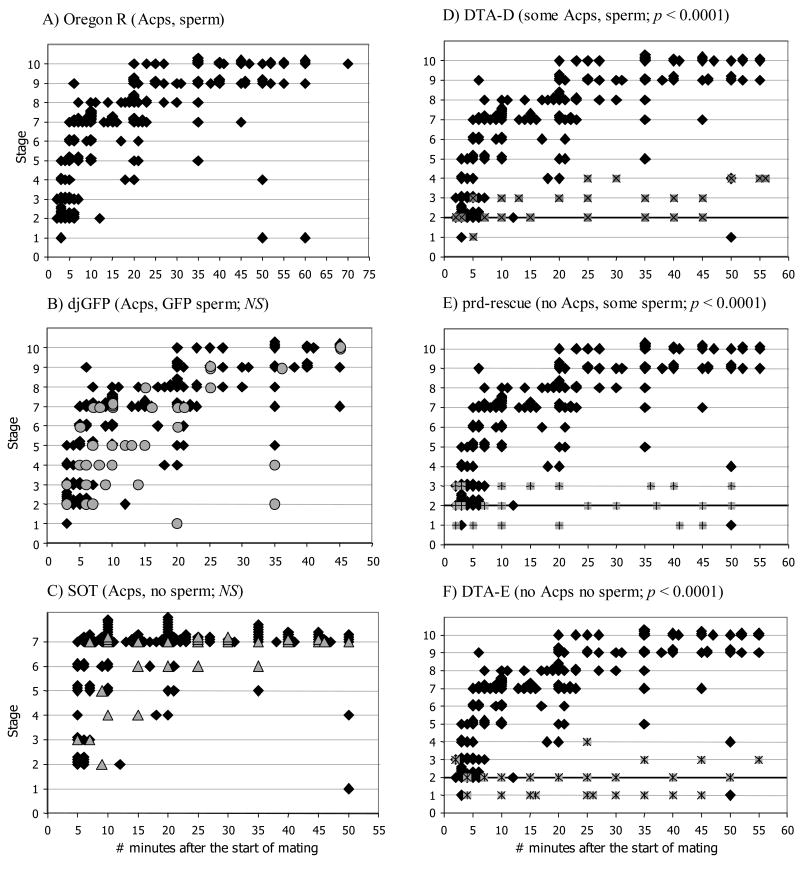
Figure 4.
Progression of stages of morphological change and sperm movement in the female reproductive tract during and after mating (Stages 1–10). Oregon R females were mated once to males that delivered different combinations of accessory gland proteins (Acps) and sperm: (A) Oregon R males (black diamonds) deliver wild-type amounts of both Acps and sperm; (B) dj-GFP males (grey circles) deliver wild-type amounts of Acps and GFP-labeled sperm; (C) Son of tudor males (SOT; grey triangles) deliver wild-type amounts of Acps, but no sperm; (D) DTA-D males (X's superimposed on grey squares) deliver reduced amounts of Acps and sperm; (E) prd-rescue males (+'s superimposed on grey squares) deliver sperm but no Acps; (F) DTA-E males (*'s superimposed on grey squares) deliver neither Acps nor sperm. (B-F) Each pairwise comparison tested the null hypothesis that the coefficient of the interaction term was zero (ASM*Genotype; see text for details). (D-F) The thickened line at Stage 2 serves as a reference when comparing results from mates of DTA-D, prd-rescue, and DTA-E males. The length of the X- and Y-axes vary among panels to reflect the observation times used in the statistical analyses (individual pairwise comparisons were conducted only at times ASM for which data were available from both lines, see text for details). Data from Oregon R Stages 7–10 are grouped into Stage 7 in panel C to match the SOT data (mates of SOT males could not be scored beyond Stage 7 since these males to not produce sperm). P-values are as described in the text; NS = non-significant.

