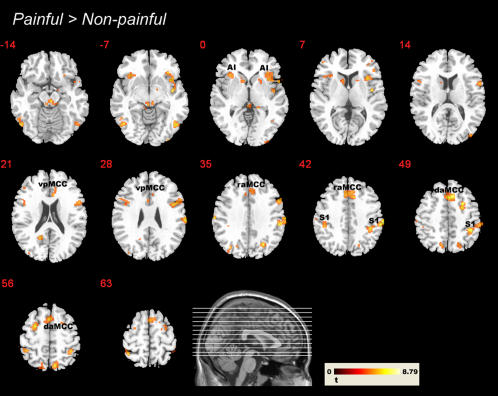
Figure 4. Significant clusters from the random effects contrast painful>non-painful (intensity and unpleasantness rating trials pooled) of fMRI experiment I, displayed on a high-resolution structural MRI template in MNI space (used in all figures, displayed in neurological convention; red numbers indicate slice number).
The anatomical labels designate the approximate location (in the rfx average) of the functional ROIs (see text for abbreviations). Threshold P = 0.01 (FDR-corrected), k = 10.

