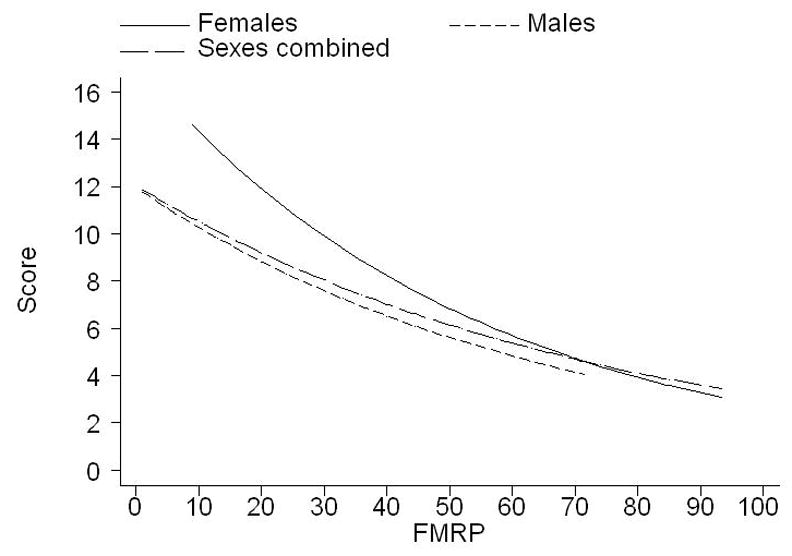
Figure 2.

Illustration of the relationship between CSIT score of ADOS (SCORE) and FMRP levels in the full mutation category for females and males separately and combined (Australian and American data combined). The relationship is represented by plots of fitted values based on negative binomial regression of CSIT score on FMRP levels.
