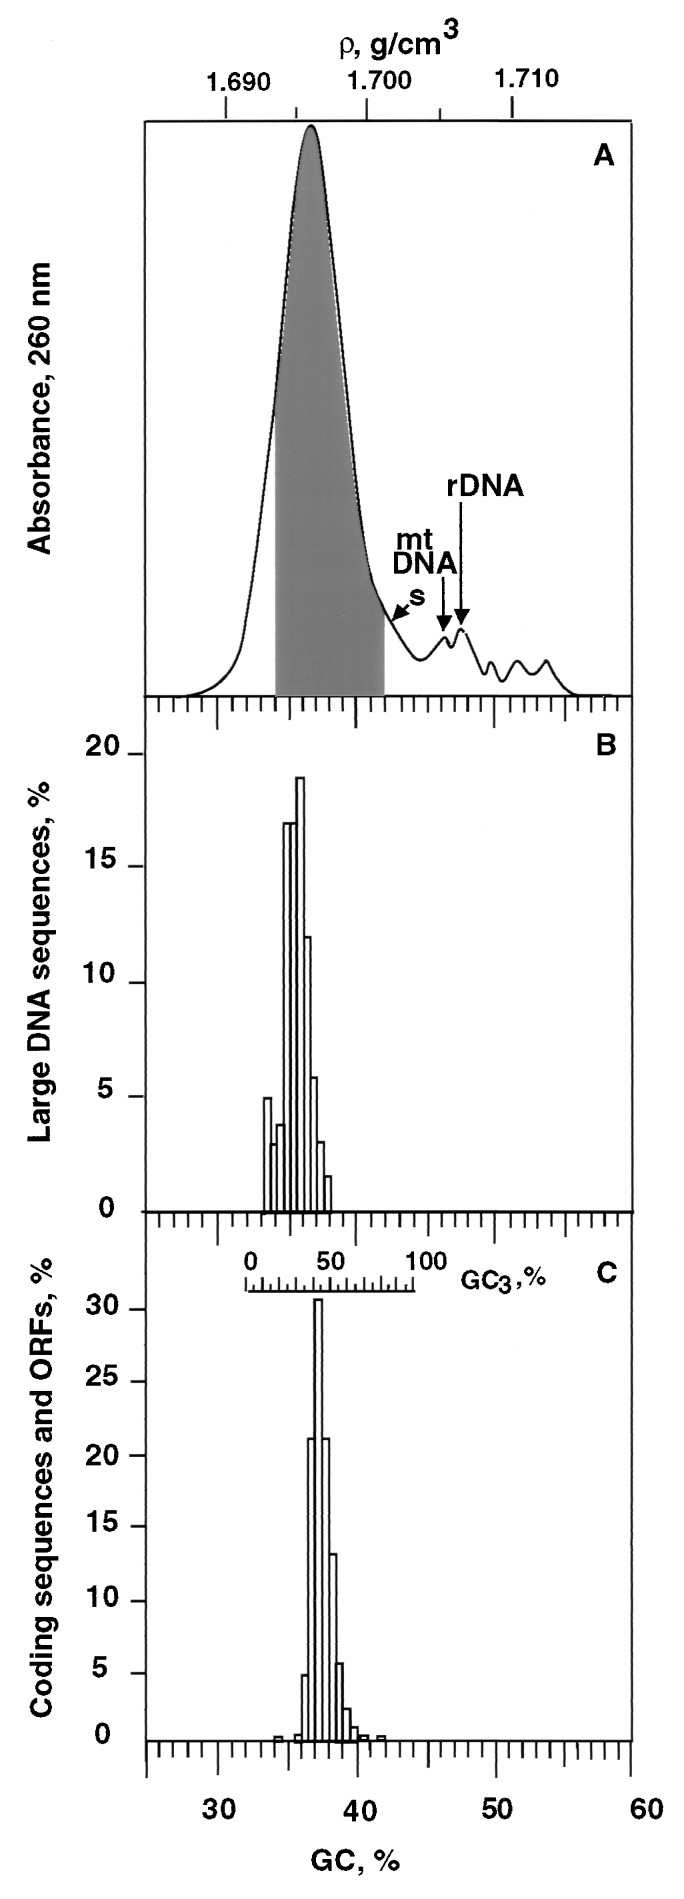
Figure 1.
(A) Absorbance profile of Arabidopsis nuclear DNA as obtained by centrifugation in a CsCl analytical density gradient. The shoulder (s) may correspond to contaminating chloroplast DNA, the following small peaks to contaminating mitochondrial DNA (ρ = 1.706 g/cm3), rDNA (ρ = 1.707 g/cm3), and to three satellite DNAs (see text). The shaded area corresponds to the DNA fractions containing nuclear protein-encoding genes (see legend of Fig. 2). (B) Compositional distribution of large (>50 kb) GenBank DNA sequences from Arabidopsis. (C) Gene distribution obtained by plotting the relative number of Arabidopsis genes against their GC3 values (top scale); 2,490 sequences from GenBank (release 103; October 15, 1997) were used to construct the histogram. In C, the common GC abscissa of the three plots represents the GC values of the DNA fractions containing the genes (as derived from Fig. 2).

