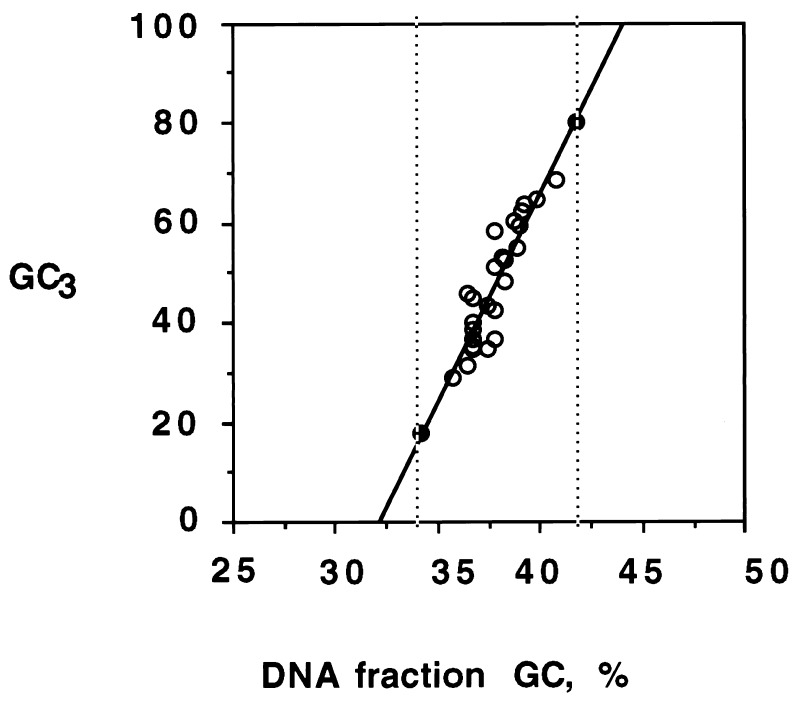
Figure 2.
Plot of GC3 of genes (circles) versus GC values of DNA fractions corresponding to the hybridization peaks (from the data of Table 1). The solid circles represent the two extreme GC3 values of Arabidopsis genes as found in GenBank. The vertical broken lines indicate the GC range of the DNA fractions containing the genes. This was used to define in Fig. 1A (shaded area) the DNA range in which genes are located.

