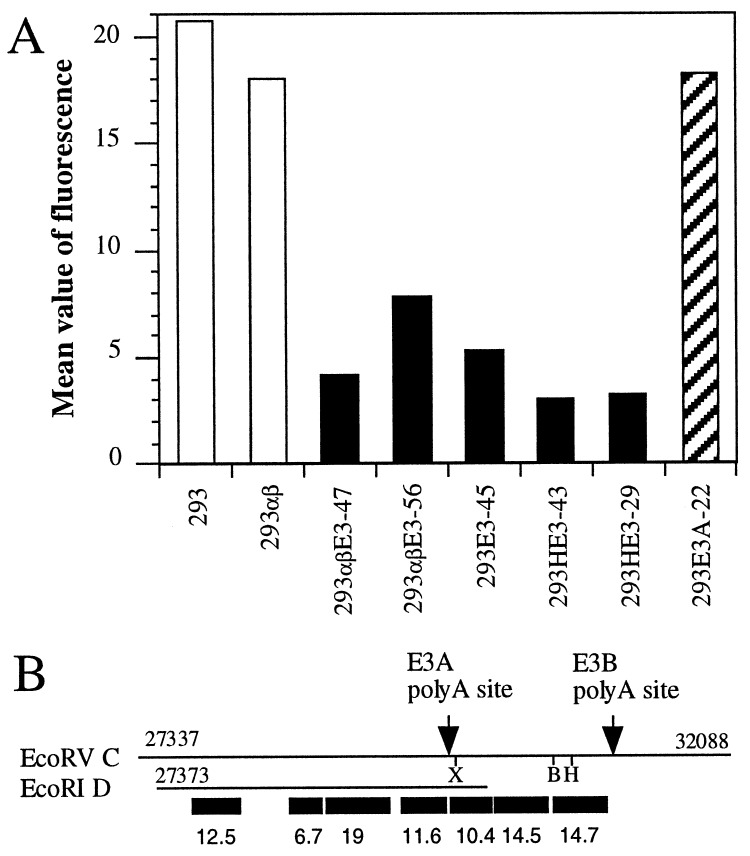
Figure 1.
Down-regulation of Fas cell surface expression in E3+ 293 cells. 293 cells and derivatives were stained for cell surface expression of Fas using the mAb anti-APO-1. Flow cytometry revealed on average an 80% reduction of Fas cell surface expression on E3+ 293 cells (■). 293αβ cells expressing human major histocompatibility complex class II genes served as control transfectants. H indicates cotransfection with the hygromycin resistance gene. The data represent the mean of two experiments. Background staining obtained with the secondary antibody alone was deducted. (B) Schematic representation of the E3 transcription unit of Ad2. The two lines refer to the two DNA fragments used to generate the above transfectants. The EcoRV C fragment includes all E3 genes whereas the EcoRI D fragment only encompasses 12.5K, 6.7K, 19K, 11.6K, the E3A poly(A) site and a truncated 10.4K gene. As this DNA fragment lacks the E3B poly(A) site 10.4K is not expressed. Poly(A) sites and the restriction sites used for mutating and cloning are indicated. X, XhoI; B, BglII; H, HpaI. ORFs, ■.

