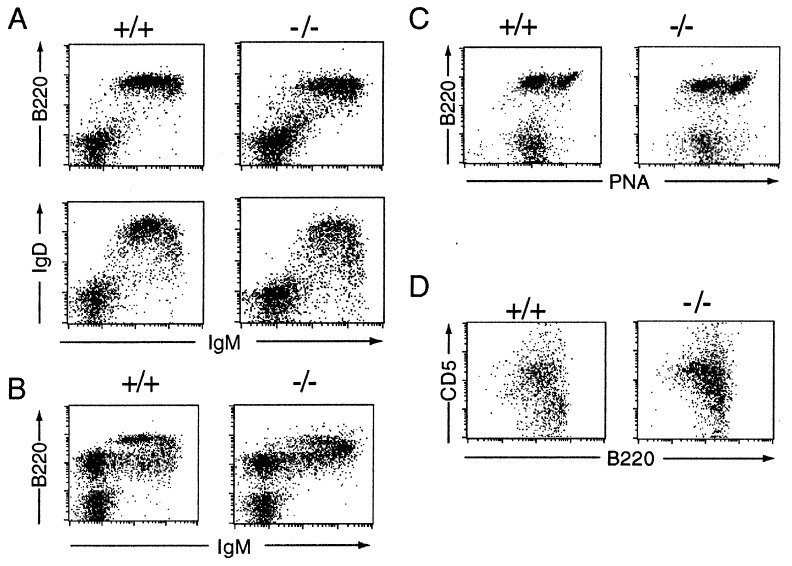
Figure 3.
Flow cytometric analysis of B cell populations. The profiles are representative of results obtained with between four and six mice. (A) Spleen cells were stained with fluorescein isothiocyanate-conjugated anti-IgM and either phycoerythrin-conjugated anti-CD45R(B220) or anti-IgD. The median fluorescence of the anti-IgM staining of the CD45R(B220)+ cells in the μs−/− mice was 475 ± 80, compared with 225 ± 20 in their normal littermates. (B) Bone marrow. (C) Peyer’s patch cells were stained for B220 and peanut agglutinin (PNA). (D) Peritoneum. Analysis of CD5/CD45R(B220) staining is shown for cells gated as IgM+. In μs−/− mice, 65 ± 9% of the CD45R(B220)+ peritoneal cells were CD5+ compared with 38 ± 7% in controls.

