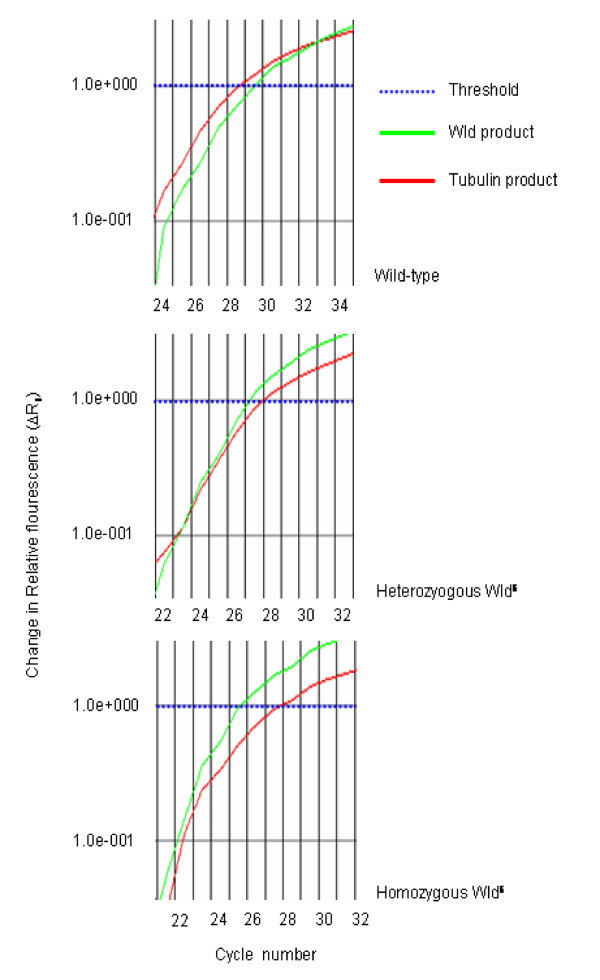
Figure 3.
Real time data shows differences between wild-type, heterozygous and homozygous animals. Screen grabs from ABI software. The curves show the difference in cycle number (ΔCt) between tubulin (pseudo-coloured red) and Wlds (pseudo-coloured green) for each genotype at the set threshold (1.0e+000, pseudo-coloured blue). These are representative curves only and should be viewed in conjunction with Figure 4.

