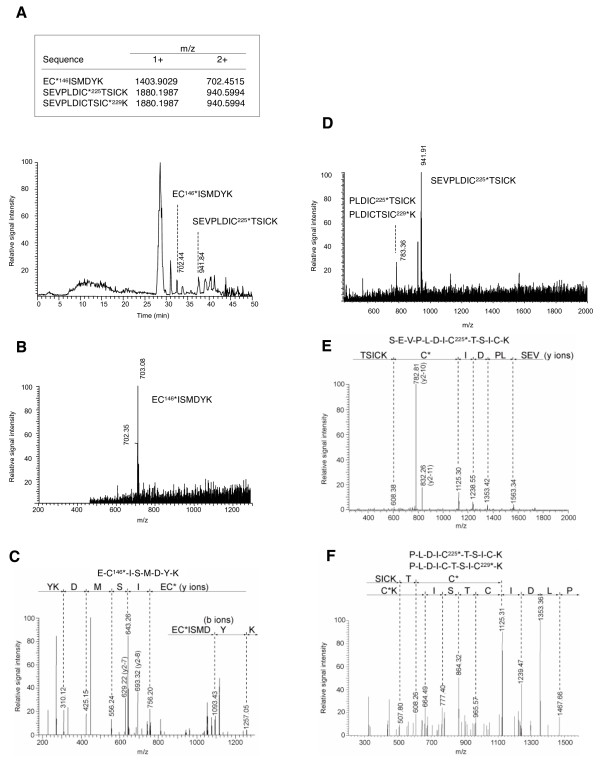
Figure 4.
Analysis of L1-cysteine residues that have bound to BPEOIA by mass spectrometry. (A) Chromatogram of the tryptic peptides of L1 that bound to BPEOIA. The upper box shows calculated monoisotopic mass value of mono (1+) and doubly (2+) charged masses of three peptides. The asterisk denotes a cysteine bound with BPEOIA. (B and D) Full scan mass spectra corresponding to the EC146*ISMDYK (B) and SEVPLDIC225*TSICK (D). (C, E and F) MS/MS spectra of corresponding to EC146*ISMDYK (C), SEVPLDIC225*TSICK (E), PLDIC225*TSICK and PLDICTSI C229*K (F).

