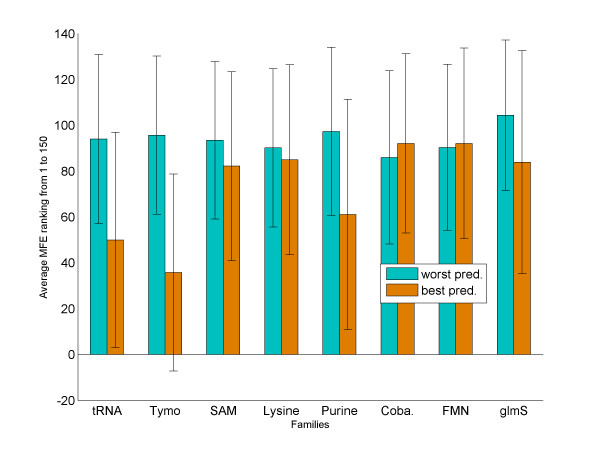
Figure 1.
Average ranking of the best/worst structure prediction. The average MFE rank of the predicted structure with the best and worst MCC scores. On average, the rank of the best structure (orange) is better (lower) than that of the worst structure (cyan). However, the standard deviation of these averages is very large.

