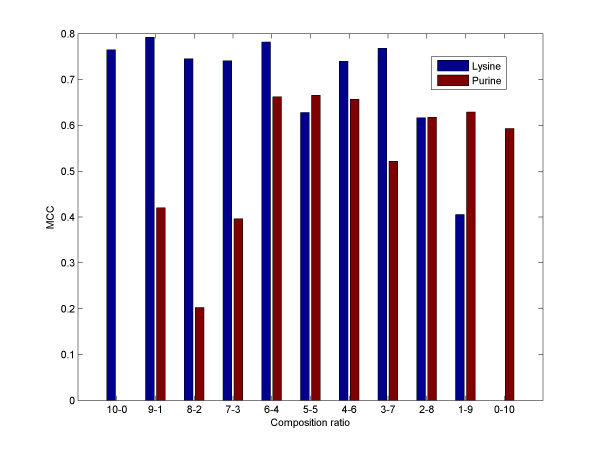
Figure 11.
An example with a contaminated dataset. The leftmost bar represents the MCC score of a set of ten Purine sequences. The rightmost bar represents a set of ten sequences from the Lysine family. Towards the middle of the graph, the sets become more and more mixed. Note that with increasing contamination, the results tend to deteriorate, but in general the method is robust to low levels of contamination.

