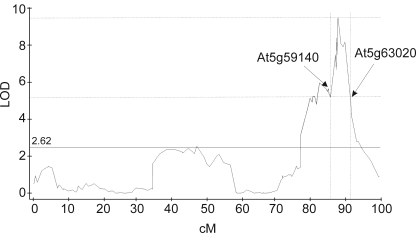
Figure 2. Bay-0×Sha QTL for Total Content of Aliphatic Glucosinolates on Chromosome V.
The total content of aliphatic glucosinolates was measured in two independent experiments on 403 lines from the Bay-0×Sha RIL population. The LOD plot from QTL Cartographer CIM module for QTL on chromosome V is shown. The significance threshold was obtained by 1,000 random permutations within QTL Cartographer. A 4-LOD confidence interval around the QTL is depicted (vertical dotted lines) and the arrows show the position of the genes marking the 4 LOD interval.

