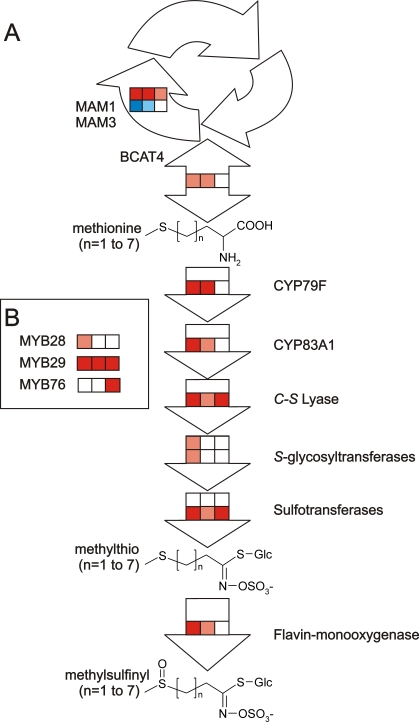
Figure 5. Altered Transcript Levels for Genes in the Biosynthetic Pathway of Aliphatic Glucosinolates in the 35S:MYB lines.
A. Altered transcript accumulation for the biosynthetic genes. B. Altered transcript accumulation for the MYB transcription factors by the different 35S transgenes. Nested ANOVAs were utilized on microarray data to test for altered transcript levels for biosynthetic genes in the aliphatic glucosinolate pathway. Each arrow represents a specific biosynthetic process with the transcript alteration for each of the different enzymes indicated as separate rows of boxes. From left to right, the boxes in each row illustrates the comparison of the transcript levels in, respectively, the 35S:MYB28, 35S:MYB29 and 35S:MYB76 transgenes versus Col-0. The enzymes are listed in Table S10. Genes with a statistically significant altered transcript increase in the given 35S:MYB line are shown as red while those with a decrease are in blue. Dark color represents a change of 50 percent or more while the lighter color shows a change of less than 50 percent.

