
FIG. 7.
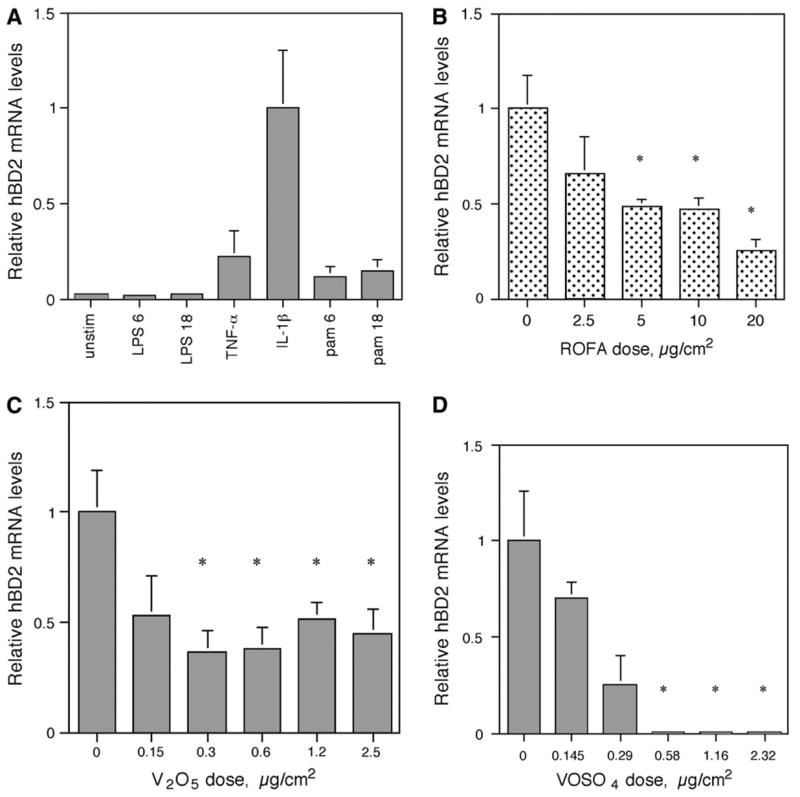
Gene expression of human β-defensin-2 (hBD-2) in A549 cells using quantitative PCR. (A) Induction of hBD-2. A549 cells were either unstimulated or treated with LPS (100 ng/ml) for 6 h (LPS 6) or 18 h (LPS 18), TNF-α (50 ng/ml) for 6 h, IL-1β (100 ng/ml) for 6 h, Pam3CSK4 (300 ng/ml) for 6 h (pam6) or 18 h (pam18). Total RNA was isolated from A549, reverse transcribed, and then amplified by QPCR for hBD-2 with SYBR Green (representative experiment one of three). hBD-2 expression was normalized to HPRT. Error bars = 95% confidence limit of three QPCR reactions per RNA sample. (B) Inhibition of hBD-2 expression by ROFA. A549 cells were treated with or without ROFA for 6 h and then stimulated with IL-1β (100 ng/ml) for 6 h. hBD-2 mRNA levels were quantified as above. For each sample within an experiment, triplicate values were averaged and then the means of the QPCR results from three experiments were compared and analyzed statistically. Each bar containing ROFA represents the mean ± SEM. Asterisks represent significantly lowered induction of hBD-2 by ROFA compared with IL-1β alone (relative level = 1); p ≤ 0.03 by the Student’s t-test. (C) Inhibition of hBD-2 expression by V2O5. A549 cells were treated with or without V2O5 at molar equivalent doses of ROFA as performed in (B), above, for 6 h and then stimulated with IL-1β (100 ng/ml) for 6 h. hBD-2 mRNA levels were quantified as above. For each sample within an experiment, triplicate values were averaged and then the means of the QPCR results from three experiments were compared and analyzed statistically. Error bars represent the mean ± SEM. Asterisks represent significantly lowered induction of hBD-2 by V2O5 compared with IL-1β alone (relative level = 1); p ≤ 0.05 by the Student’s t-test. (D) Inhibition of hBD-2 expression by VOSO4. A549 cells were treated with or without VOSO4 at molar equivalent doses of ROFA as performed in (B), above, for 6 h and then stimulated with IL-1β (100 ng/ml) for 6 h. hBD-2 mRNA levels were quantified as above (n = 3). Error bars represent the mean ± SEM. Asterisks represent significantly lowered induction of hBD-2 by VOSO4 compared with IL-1β alone (relative level =1); p ≤ 0.05 by the Student’s t-test.