
TABLE 1.
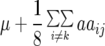
Expectation (ɛ(X)), variance ( (X)), and conditional expectation (ɛ(X | QTL i)) of the contrast between the two homozygous marker classes at the position of QTL i and conditional expectation (ɛ(X | QTL i × QTL j)) of the interaction between the two homozygous marker classes at the positions i and j for X = Z1, Z2, Z3, and H3 in terms of genetic effects of the F2-metric under digenic epistasis in the absence of linkage
| Statistica
|
|||||||
|---|---|---|---|---|---|---|---|
| Variable X | ɛ(X) |  |
ɛ(X | QTL i) | ɛ(X | QTL i × QTL j) | |||
| Z1 |
|
|
|
aaij + ddij | |||
| Z2 |
|
|
|
adij + daij | |||
| Z3 |
|
|
|
2ddij | |||
| H3 | μ |
|
ai | aaij | |||
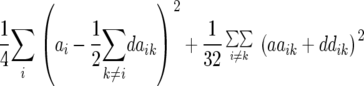
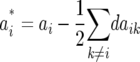

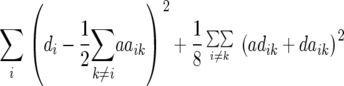
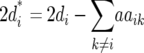
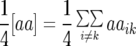
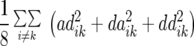
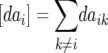
For description of Z1, Z2, Z3, and H3 and for notation of genetic effects see materials and methods.
a
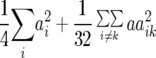
Summation is over the entire set of QTL involved in the trait expression.