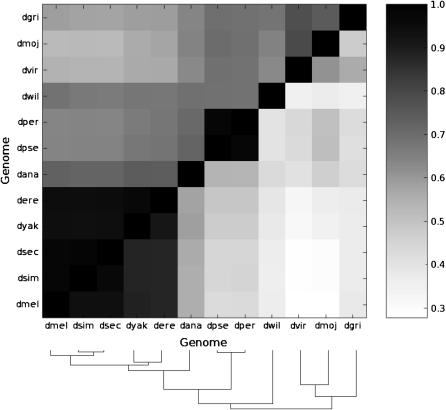
Figure 4.—
Variations in codon usage bias are consistent with the species' phylogeny. Correlations between codon usage bias indices across 6138 orthologs for each pairwise species comparison, shaded according to correlation strengths. Top diagonal, CAI based on ribosomal protein gene weights; bottom diagonal, ENC (see adjacent bar for scale). Note that the correlation between species' codon usage biases is stronger when CAI is used as a measure. All correlations are highly significant (P < 0.001). The species' phylogeny is provided at the bottom of the chart for ease of reference.

