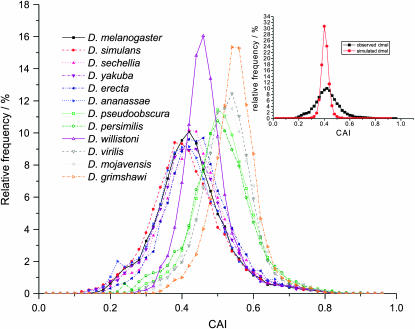
Figure 5.—
CAI value histograms for genes from 12 Drosophila species. These distributions are broader and are increasingly left shifted with increasing strengths of codon usage bias. CAI values of each gene were computed on the basis of codon usage preferences in ribosomal protein genes. The inset shows the effect of selection for codon usage bias on the distribution of CAI values. In the simulations, codons were chosen randomly for all 13,831 D. melanogaster genes according to the bulk codon usage in D. melanogaster. The observed distribution of CAI values is broader than the distribution of simulated CAI values, showing that a disproportionate number of genes have higher or lower codon usage than expected.

