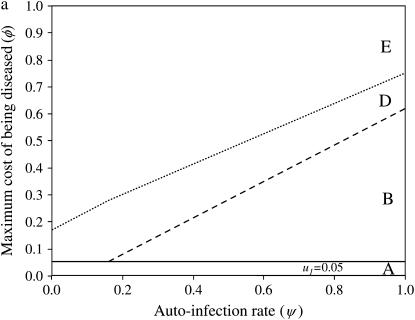
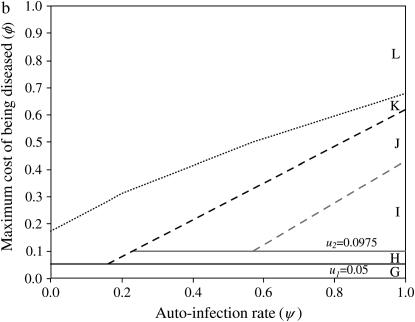
Figure 1.—
Stability area plots for a two-locus model with independent costs of alleles at different loci (model B1), in relation to values of the autoinfection rate (ψ) and the cost to a plant of being diseased by two parasite generations (φ). u1, u2, costs of host resistance; b1, b2, costs of parasite virulence; u1 = b1 = 0.05, u2 = b2 = 0.0975 (subscript 1, cost of one allele; subscript 2, cost of two alleles). (a) Stability of polymorphism in the host population. Area A, fixation of double-susceptible genotype 00; area B, stable polymorphism with 00 and the single-resistant genotypes 10 and 01; area D, unstable polymorphism with 00, 10, 01; area E, fixation of 00. (b) Stability of polymorphism in the parasite population. Area G, fixation of the double-avirulent genotype 11; area H, stable polymorphism with 11 and the single-avirulent genotypes 01 and 10; area I, stable polymorphism with all four genotypes; area J, stable polymorphism with 10, 01, and the double-virulent genotype 00; area K, unstable polymorphism with 10, 01, 00; area L, fixation of 00.


