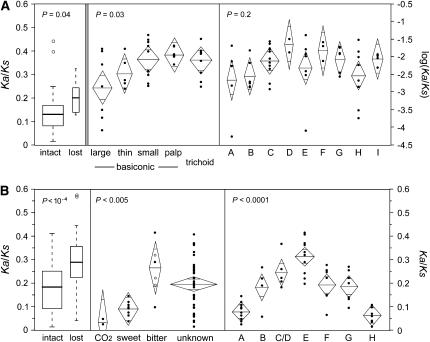
Figure 6.—
Variation in mean Ka/Ks among subsets of Or genes (A) and Gr genes (B). The left section in each row contrasts genes that remain intact along all lineages to those that have been lost along at least one lineage. These data were analyzed using nonparametric Wilcoxon rank-sum tests and are summarized by box plots. The middle and right sections in each row contrast functional/expression groups and evolutionary subfamilies, respectively. These data were analyzed using parametric one-way ANOVAs and are summarized by diamond plots. The horizontal line bisecting each diamond and the vertical span of each diamond represent the mean and 95% confidence interval, respectively. The width of each diamond is proportional to the square root of the number of genes in the given category. Two means are significantly different if the central areas of the diamonds, demarcated by short horizontal lines, do not overlap. The three open-circle data points in the group of bitter Grs represent the Ka/Ks values of the intact orthologs of genes that have been lost along one or more lineages. These values were excluded from the statistical analysis (as were all lost genes) but are included here for comparison with the few bitter receptors that remain intact in all lineages.

