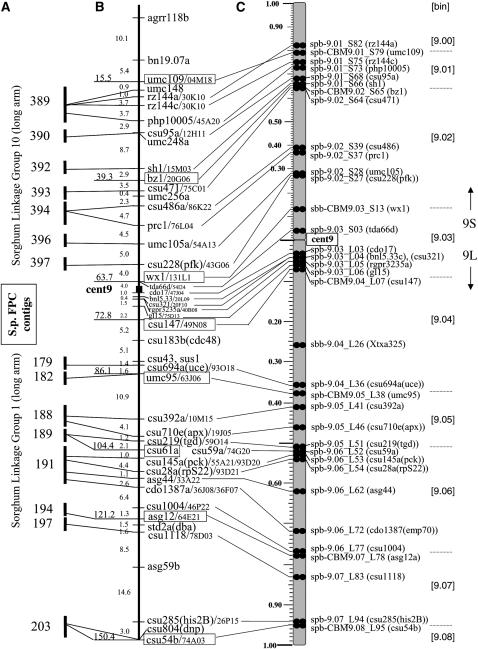
Figure 6.—
Integrated maps of maize chromosome 9. (A) Fingerprint contig numbers for the Sorghum FPC map and their associated linkage groups. (B) The maize 9 linkage map is shown as described in Figure 1, except that the cent9 location reflects the revised position as described in Figure 5. The names of the sorghum BACs used as a FISH probe are listed after the markers (after the slashes). (C) The new cytogenetic FISH 9 map showing the location (solid double circles) of loci along the short (9S) and the long (9L) arm. The S. bicolor BAC sbb18256 (Xtxa325) at 9L.27 is not located on the linkage map and the S. bicolor BAC sbb16685 (Xtxp32) was mapped to 9L.53, but is not shown. The new cytogenetic loci names are displayed at the right of the map in C and are detailed in Table 1.

