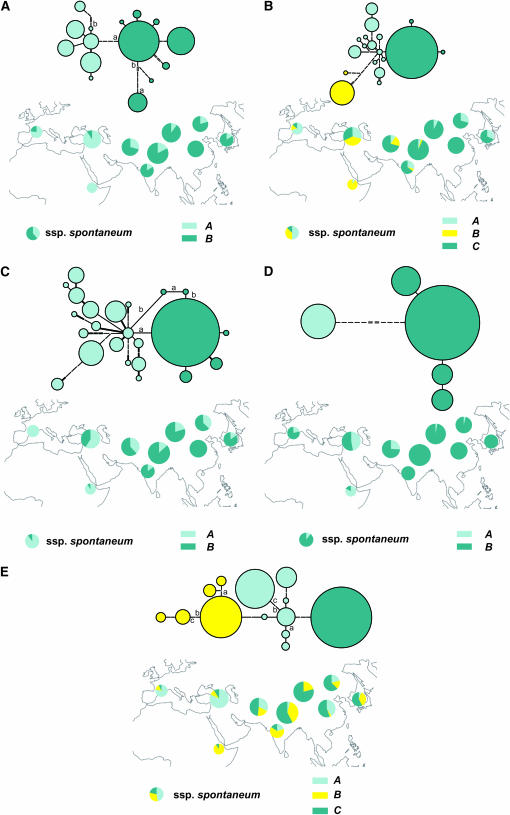
Figure 1.—
Haplotype networks of five nuclear loci and geographic distributions of the haplotype clusters. The haplotype networks for the (A) Bmy1, (B) bah45n12, (C) GSP, (D) G3PDH, and (E) Waxy genes are shown. Haplotypes observed in domesticated and wild barley are indicated by circles. Each haplotype tree represents two or three clusters in all the barley accessions. Different colors delineate specific haplotype clusters. Each line of the haplotype networks represents a single mutational step. Silent-site SNPs are indicated by thin lines and nonsynonymous mutations by thick lines. Indel mutations are shown by double lines. Homoplasious mutations are marked by lowercase letters. The sizes of the circles in the haplotype networks and maps correspond to numbers of accessions in a given haplotype or in each region. The haplotype frequencies in wild barley are given below the distribution maps for each gene. The consistency indexes (CI) are as follows: Bmy1, CI = 0.93; bah45n12, CI = 1.00; GSP, CI = 0.95; G3PDH, CI = 1.00; and Waxy, CI = 0.85.

