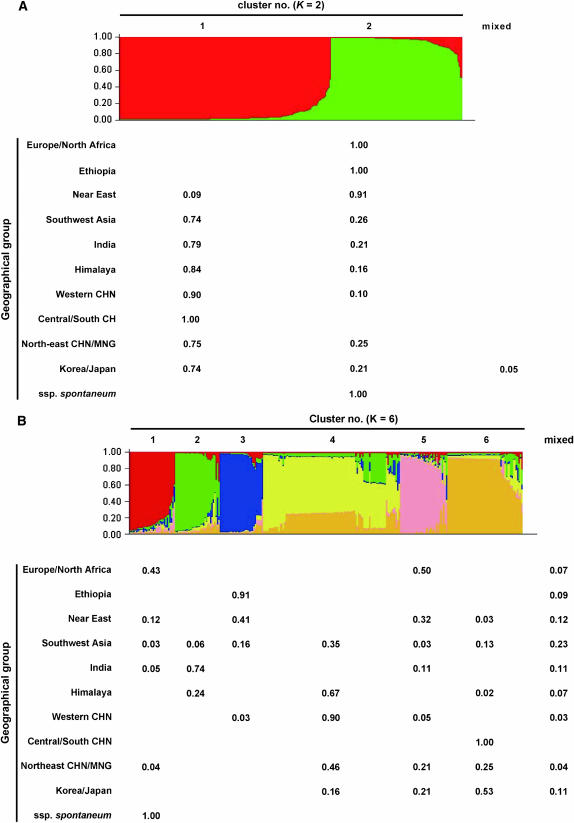
Figure 4.—
Population subdivision and the frequency distribution of barley populations in each inferred cluster. Results from both the K = 2 (A) and K = 6 (B) models are shown. Each accession is shown by a thin vertical line that is partitioned into two or six colored segments. The frequency of a cluster group within each geographic region is tabulated. The accessions in which membership probability is <50% are classified into a “mixed” group.

