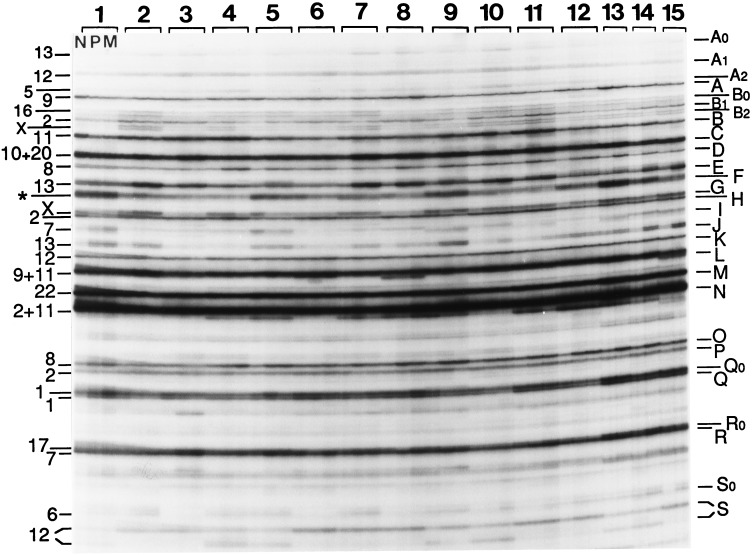
Figure 1.
AP-PCR DNA fingerprints of colorectal tumors. Autoradiogram of a denaturing polyacrylamide sequencing gel of the AP-PCR fingerprints generated by arbitrary primer MCG1 with 100 ng of genomic DNA isolated from normal and tumor tissues from colorectal cancer patients indicated at the top. The first, second, and third fingerprint lanes of each case correspond to normal tissue (N), primary tumor (P), and liver metastasis (M). N, P, and M were available from patients 1–12, and only N and M were available for patients 13–15. Numbers at the left indicate the chromosomal origin of the bands named by letters at the right. Cases 1, 3, 6, 8, 10, and 12 were males. Band F (designated with an asterisk) was a composite of at least three sequences from chromosomes 2, 11, and 22. Some other bands were composite of sequences mainly derived from at least two chromosomes, such as bands C, L, and N (23). In these cases, no estimation of intensity variations was attempted, except for band C (see text). Some double bands represent the two strands of the same DNA molecule (such as bands B0, B2, G, and J). Band S represents a length polymorphism that resolves the two alleles by their different size in heterozygous cases (cases 4, 5, 9, 10, 13, and 14). The approximate size of some of the cloned fingerprint bands (in bp): D, 800; E, 750; F, 710; J, 575; M, 525; Q, 405.

