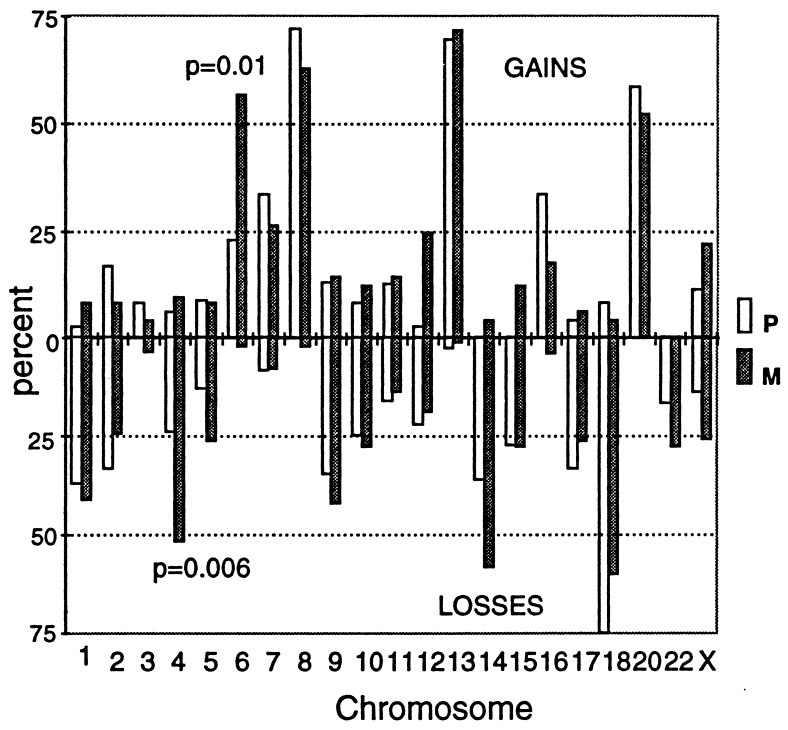
Figure 6.
Comparative amplotypes of primary and metastatic colon cancer. The symbols are as in Fig. 4. Percentages indicate the average values of gains and losses from the multiple fingerprint bands for each chromosome (when appropriate, see Fig. 4) in the 12 primary (Dukes’ D) and 25 metastatic tumors. The P values of the comparison between primary (P) and metastatic (M) tumors were calculated by the Fisher exact test. Only statistically significant values are shown (losses of chromosome 4 and gains of 6) with the exception of chromosome 12 gains (P = 0.003). The P values considering only the 12 cases with primary and metastatic tumors from the same patients were P = 0.024 for chromosome 4 losses and P = 0.057 and P = 0.099 for chromosome 6 and 12 gains, respectively. Therefore, only the losses of chromosome 4 and gains of chromosome 6 are considered to be significantly increased in metastatic vs. primary tumors.

