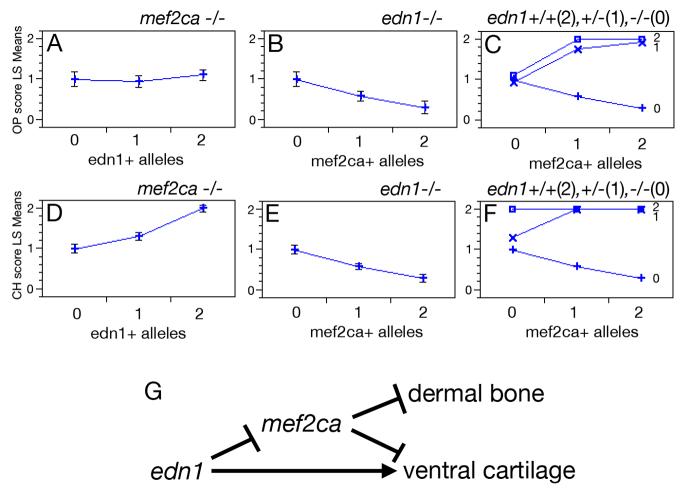
Fig. 4.
Epistatic interactions between mef2ca and edn1. Hyoid bone (opercle, OP) (A-C) and cartilage (ceratohyal, CH) (D-F) phenotypes as a function of: edn1+ alleles in homozygous mef2ca mutants (A,D), mef2ca+ alleles in homozygous edn1 mutants (B, E), and genotypes at both mef2ca and edn1 (C,F). In C and F, edn1 genotype is denoted by the number of edn1+ alleles: open box = 2 edn1+ alleles; “X” = 1 edn1+ allele, “+” = 0 edn1+ alleles. Phenotypes were scored on individual sides of PCR-genotyped larvae (see Methods). OP bone scoring scale: strong edn1 loss-of-function phenotype (loss of bone) = 0, weak edn1 loss-of-function phenotype (expanded bone) = 1, wild-type = 2. CH cartilage scoring scale: strong edn1 loss-of-function phenotype (complete loss) = 0, weak edn1 loss-of-function phenotype (partial loss) = 1, wild-type = 2. See Kimmel et al. (2003) and Miller and Kimmel (2001) for strong and weak edn1 loss-of-function bone and cartilage mutant phenotypes. Phenotypes for each genotypic category are shown as least square means (LS means). Error bars represent 95% confidence intervals from ANOVA. (G) Genetic model for zebrafish hyoid cartilage and dermal bone development. mef2ca represses bone and cartilage formation. edn1 represses mef2ca, but also activates a mef2ca-independent pathway for ventral cartilage development.

