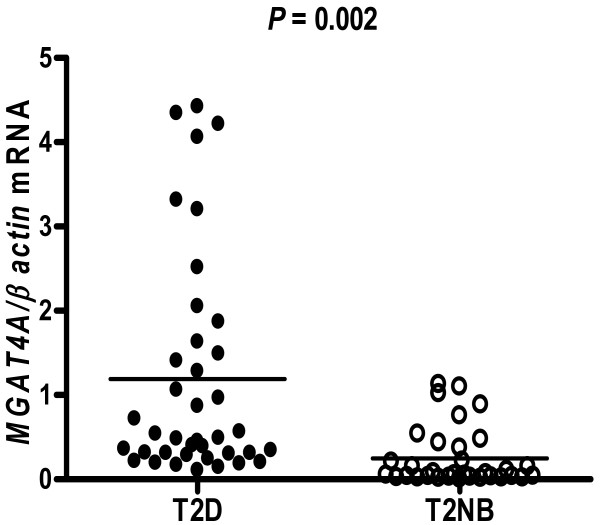
Figure 2.
MGAT4A mRNA expression in the phenotypic groups. Individuals in each phenotypic category were grouped according to the clinic and biochemical parameters as T2D, type 2 Diabetes subjects and T2NB, healthy no T2D background subjects. mRNA levels were quantified by Real-Time PCR and normalized to mRNA levels of β-actin. Results are expressed as the means ± SE. ANOVA P values are shown.

